
Computational fluid dynamics (CFD) simulations for optimizing DAF systems

- 1. Introduction: CFD (Computational Fluid Dynamics) Simulations
- 2. Description of the case study
- 3. Simulation results
- 4. Proposed actions for the solution of turbulences
- 5. References and acknowledgments
1. Introduction: Computational Fluid Dynamics(CFD) simulations
Fluid dynamics simulations (CFD) are applied in hydraulic flow systems and transport processes.They are standard development tools for constructions and equipment with fluid components. Today, CFD simulations are indispensable in all types of engineering, including water treatment.
Within the field of water treatment, CFD programs simulate the fluid-dynamic reality and the behavior of fluids and phases (water, air, solids...), which can be difficult to observe directly in water treatment equipment. In addition, they allow to predict the effects that would occur if any operating conditions (pressures, flow rates, etc.) are changed.
These simulations offer mainly:
- Validation of approximation models through measurements.
- Deterministic analysis using indicators.
- Increased equipment efficiency through optimization plans, considering economic viability.
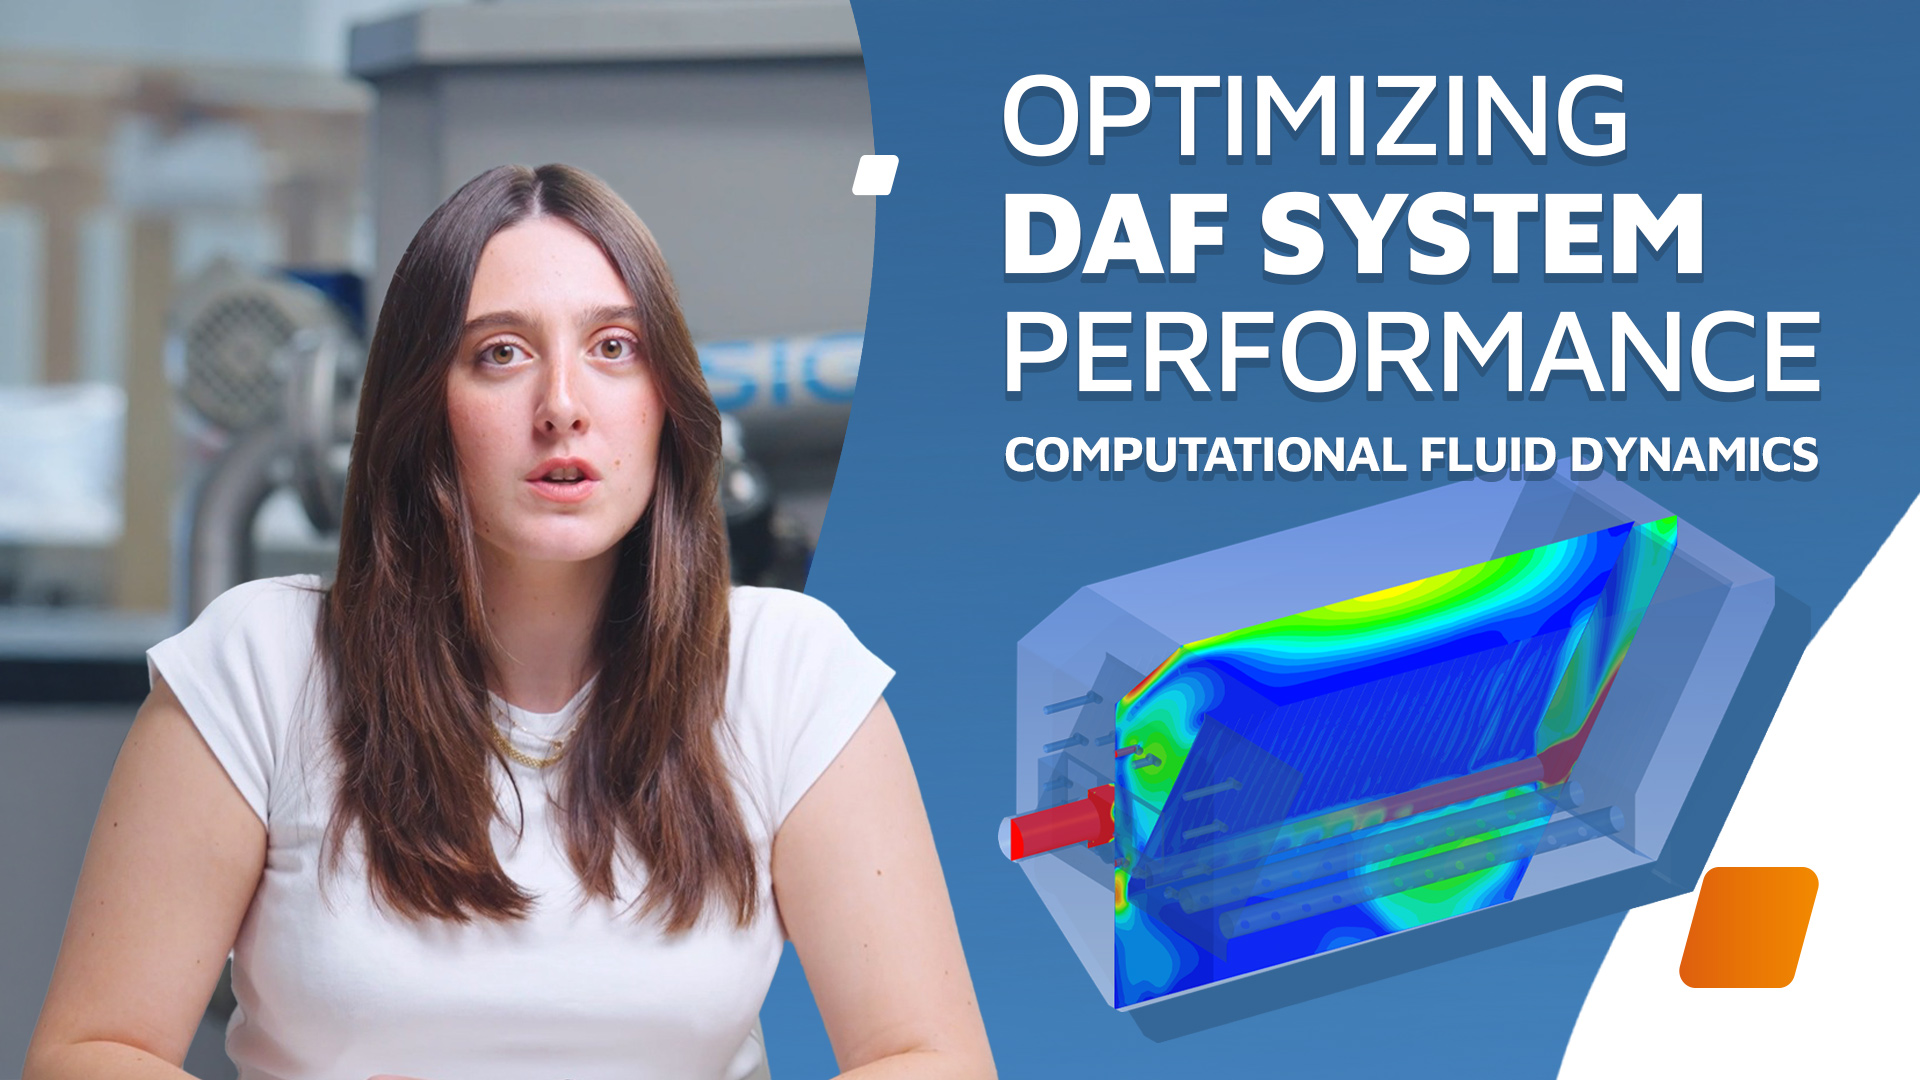
Next, we are going to see how SIGMADAF carried out CFD simulations to understand the extraordinary behavior of a DAF FPHF 750 equipment installed for a customer that produces chemicals for food preparation.
These simulations have been carried out in collaboration with Hydrograv, a company specialized in fluid dynamics simulations, and the Instituto Tecnológico de Aragón.

The objective is to understand why the water flow behaves in an extraordinary way and to use the findings of the study for mechanical and operational improvement of the equipment. This valuable information is also used to refine the next designs and constructions of this DAF model.
2. Description of the case study
The equipment studied is a DAF system, model FPHF 750. This equipment is practically identical to other equipment previously installed, but suffers from operating problems related to the turbulence that the flow experiences in the inlet zone of the equipment. Turbulence is defined as non-uniform velocity distribution at the inlet of the equipment.
Before carrying out the fluid dynamics simulations, two specific objectives are established:
- Identify the causes of increased turbulence in the effluent inlet zone based on two key elements: flow rates and inlet pipe configuration.
- Propose and analyze design options that reduce this turbulence.


CFD simulations compare the design values versus this customer's specific values for the inlet flow rate and the configuration of the feed pipe to the DAF.
CFD simulations also provide a clear view of the DAF operation and reveal possible points to optimize, both mechanically and in terms of performance. Specifically, they point to a redesign of physical parts that would allow a hydraulic optimization leading to an increase in floc separation efficiency.
All relevant processes are taken into account:
- Water flow rate.
- Water velocity.
- Behavior of microbubbles.
- Flotation/sedimentation behavior of particles and flocs
- Influence of lamellae.
2.1 Equipment geometry
This is the simplified geometry of the SIGMADAF FPHF 750 unit. This geometry is the template for the CFD simulations.

The inlet piping installed by the customer has elbows with a 60º angle, different from the standard configuration recommended by Sigma, at 90º.

The inlet flow to the DAF collides with a plate, at which point it splits into two streams. Each stream then passes through a 380 x 380 mm window, which are symmetrically located, as shown in Figure 6. Once through the window, the flow encounters a baffle that orients it in a vertical direction. Turbulence is produced in the upper discharge zone.

The symmetrical configuration seeks to divide the flow equally through each window. However, there may be factors that break the flow symmetry and generate a preferential direction towards one of the windows, contributing to turbulence and the escape of sludge flocs towards the clarifier outlet.
To confirm this hypothesis, CFD simulations are performed to analyze the influence of the velocity distribution observed in the inlet zone.
Boundary conditions
Multi-phase simulations are carried out with air and water in which air bubbles are modeled as the dispersed phase.
Water flows into the DAF through a DN600 pipe, coming from the flocculation tank upstream of the DAF. The beginning of the pipe (upper elbow) is not completely filled, as shown in the following picture:

Table 1 shows the boundary conditions applied to the CFD simulations. This table shows the differences between the design conditions for which the equipment was built and the conditions generally applied by the customer.
Table 1. Boundary conditions for CFD simulations.
| Parameter | units | Design values | Customer values |
|---|---|---|---|
| Inlet flow rate | m3/h | 725 | 400 |
| Recirculated flow rate | m3/h | 100 | 100 |
| Total entry | m3/h | 825 | 500 |
| Minimum design flow rate | m3/h | 550 | 550 |
| Air flow consumed | L/min | 150 | 150 |
| Microbubble diameter | µm | 30 - 50 | 30 - 50 |
2.3 Definition of particles and flocs
Particles can be considered part of the aqueous phase using an algebraic slip model. The relative particle velocity is based on literature data and analysis of real flocs. Depending on the density of the particles and their attachment to the microbubbles, they may settle, remain floating at the same level or rise to the surface.
The relative particle velocity is assumed by an approximation. When microbubbles adhere to a sludge floc, the density of the floc decreases below the density of water and the upward velocity of this agglomerate (sludge - air) increases.
The exact value of the upward velocity is unknown and is different for each floc. For this reason, a range of upward velocities, which are physically possible, is established in the CFD simulations. These relative velocities are listed in Table 2.
Table 2. Estimated particle velocities. Negative values mean that they are ascending (negative "sedimentation" velocity).
| Particle type | Range of sedimentation velocity (mm/sec)*. |
|---|---|
| High | (-100) - (-1,0) |
| Floating in the middle of the DAF | 0,0 |
| Sedimented | 0.5 - 2,0 |
3. Results of fluid dynamics simulations
3.1 Simulation of the water, air and particulate phases in the DAF for the Design and Client systems.
The inlet flow is diverted twice in the inlet pipe (once at each elbow) and then diverted again in the inlet window before entering the DAF. The inlet velocities are greater than 90 cm/second in the SIGMADAF designed system, but are between 50 - 60 cm/second in the customer operated DAF system (Figures 8 (5.1) and 9 (5.3)).


Given the high inlet velocities and nearly horizontal flow in the Design system, the flow impinges on the inclined inlet plate nearly horizontally and is mainly diverted upward to the top of the tank (Figure 10, left).
In the Client system, velocities are lower and therefore only part of the flow is diverted upward (Figure 10, right). In the Client system, a downward flow through the inlet opening can be observed, therefore, there is a flow short-circuit between the inlet and outlet of the pipe, which most likely leads to an increase in the amount of flocs in this area.

The air distribution in the tank is shown in Figure 11 and 12. The microbubbles have only a small inherent movement due to their low upward velocity and are transported mainly by flow effect. Due to the lower flow rate in the Client's system, the microbubbles are transported slowly and have a longer residence time and higher concentration than they would have in the Design system.


Figure 13 and 14 show the turbulent kinetic energy in the tank. The highest values are detected at the outlet of the inlet section to the DAF.


Due to the lower inlet flow, velocities and turbulent kinetic energy, the phase separations are greater in the Client system. In the Design system, the rising particles are transported to the top and then part of them to the bottom by the action of the lamellae, as seen in Figure 15. In the Customer system, part of the particles is transported directly to the bottom with the flow, without passing through the lamellae.

3.2 Input window configuration study
In addition to the CFD simulation of the entire DAF including the inlet piping, extraordinary simulations are carried out with special focus on the inlet windows described in section 2.1. The results are shown in Figure 16 and 17.
The velocity profile generated in the parallel windows causes different flow rates in each window, but the cutting of the sheet metal between the windows negligibly reduces the difference in flow rates and velocities manifested in the inlet zone.


3.3 Study of the orientation of the inlet flow to the DAF
Finally, the case is simulated in which the water does not enter from a tank falling through a pipe, but enters the DAF in a linear fashion directly oriented towards it, as would occur in the case in which a plug-flow PFL flocculation system would have been applied. The result is shown in Figure 18.
The shape of the flow velocity profile at the inlet of the elbows plays a fundamental role in the flow distribution between the windows. In the case where the flow arrives perfectly developed directly oriented towards the DAF inlet, a homogeneous distribution is seen between the two windows. On the other hand, when considering the outflow coming from the discharge of an upstream tank, the flow entering the DAF is highly deformed, which prevents a homogeneous distribution between the two windows.


4. Actions proposed to solve the turbulences
The hypothesis-action pairs for the different scenarios studied are listed below.
A) Due to the lower flow rate in the Client's system, a short circuit in the flow distribution is caused causing a carry-over of particles to the bottom of the DAF in the inlet area of the DAF. To avoid this, one option is to block the bottom opening as shown in Figure 19.

B) Cutting sheet metal to join parallel windows would not contribute to the improvement of flow distribution and inlet velocities, therefore this action would be discarded.
C) A configuration of the inlet pipe so that it is perfectly oriented towards the DAF would allow homogeneous flow distribution, which could reduce turbulence.
All these assumptions and actions are taken into account for future projects. SigmaDAF's objective is the continuous improvement of its equipment to adapt it to each situation.
5. References and acknowledgments
ANSYS (2021): ANSYS FLUENT Theory Guide; Release 2021 R1.; ANSYS Inc.: Canonsburg, PA, USA.
Wilcox, DC (1998): Turbulence Modeling for CFD. DCW Industries, Inc. La Canada, California.
Acknowledgments:
Are you interested in this solution?
BASIC INFORMATION CLAUSE
DATA CONTROLLER: SIGMADAF CLARIFIERS, S.L. PURPOSE: To respond to the user’s request. LEGAL BASIS: Consent of the data subject. DISCLOSURES: No disclosures are anticipated, except where required by law or court order. RIGHTS: Access, rectification, erasure, objection, restriction, data portability, and withdrawal of consent. If you believe that the processing of your data does not comply with the regulations, you may contact the Supervisory Authority (www.aepd.es). ADDITIONAL INFORMATION: For more information, please see our privacy policy.